사전 환경 설치
프로메테우스, 그라파나 설치
kubectl get targetgroupbindings.elbv2.k8s.aws -A
NAMESPACE     NAME                               SERVICE-NAME                       SERVICE-PORT   TARGET-TYPE   AGE
kube-system   k8s-kubesyst-kubeopsv-5ba4835304   kube-ops-view                      8080           ip            18m
monitoring    k8s-monitori-kubeprom-1b31311eba   kube-prometheus-stack-grafana      80             ip            17m
monitoring    k8s-monitori-kubeprom-1c15095540   kube-prometheus-stack-prometheus   9090           ip            17m
EKS Node Viewer
go install github.com/awslabs/eks-node-viewer/cmd/eks-node-viewer@latest
kubectl autoscale deployment php-apache --cpu-percent=50 --min=1 --max=10
horizontalpodautoscaler.autoscaling/php-apache autoscaled

kubectl describe hpa
Name:                                                  php-apache
Namespace:                                             default
Labels:                                                <none>
Annotations:                                           <none>
CreationTimestamp:                                     Thu, 06 Mar 2025 01:14:27 +0900
Reference:                                             Deployment/php-apache
Metrics:                                               ( current / target )
  resource cpu on pods  (as a percentage of request):  <unknown> / 50%
Min replicas:                                          1
Max replicas:                                          10
Deployment pods:                                       0 current / 0 desired
Events:                                                <none>
[root@operator-host ~]# kubectl get hpa php-apache -o yaml | kubectl neat
apiVersion: autoscaling/v2
kind: HorizontalPodAutoscaler
metadata:
  name: php-apache
  namespace: default
spec:
  maxReplicas: 10
  metrics:
  - resource:
      name: cpu
      target:
        averageUtilization: 50
        type: Utilization
    type: Resource
  minReplicas: 1
  scaleTargetRef:
    apiVersion: apps/v1
    kind: Deployment
    name: php-apache
HPA란
쿠버네티스에서 HPA(Horizontal Pod Autoscaler)는 워크로드의 부하에 따라 자동으로 파드(Pod)의 개수를 조정하는 컨트롤러이다.
이를 통해 리소스를 효율적으로 사용하고 애플리케이션의 안정성을 유지할 수 있다.
HPA는 CPU 사용률, 메모리 사용량 또는 사용자 정의 메트릭(Custom Metrics)을 기반으로 동작하며 정의된 기준값을 초과하거나 미달하면 파드의 개수를 동적으로 조정한다.
HPA가 동작하기 위해 필요한 주요 구성 요소
- Metrics Server: 파드의 리소스 사용량을 수집하는 역할을 하며 HPA가 메트릭을 조회할 수 있도록 데이터를 제공한다.
- HPA 컨트롤러: 쿠버네티스 컨트롤러 매니저 내에서 동작하며 주기적으로 메트릭을 조회하고 스케일링을 수행한다.
- Target(대상 리소스): Deployment, StatefulSet, ReplicaSet 등과 같은 컨트롤러가 관리하는 워크로드 리소스를 대상으로 한다.
HPA 실습

출처 https://blog.px.dev/autoscaling-custom-k8s-metric/
HPA(수평 Pod 자동 확장) 가 php-apache Deployment CPU의 사용량에 따라 자동으로 Pod 개수를 조정되는지 확인해보도록한다.
샘플 php-apache 배포
cat << EOF > php-apache.yaml
apiVersion: apps/v1
kind: Deployment
metadata:
  name: php-apache
spec:
  selector:
    matchLabels:
      run: php-apache
  template:
    metadata:
      labels:
        run: php-apache
    spec:
      containers:
      - name: php-apache
        image: registry.k8s.io/hpa-example
        ports:
        - containerPort: 80
        resources:
          limits:
            cpu: 500m
          requests:
            cpu: 200m
---
apiVersion: v1
kind: Service
metadata:
  name: php-apache
  labels:
    run: php-apache
spec:
  ports:
  - port: 80
  selector:
    run: php-apache
EOF
kubectl apply -f php-apache.yaml
HPA 적용
kubectl autoscale deployment php-apache --cpu-percent=50 --min=1 --max=10
CPU 사용률이 파드의 요청 값 대비 50% 이상이 되면 자동으로 파드를 증설하는 HPA 정책을 생성한다.
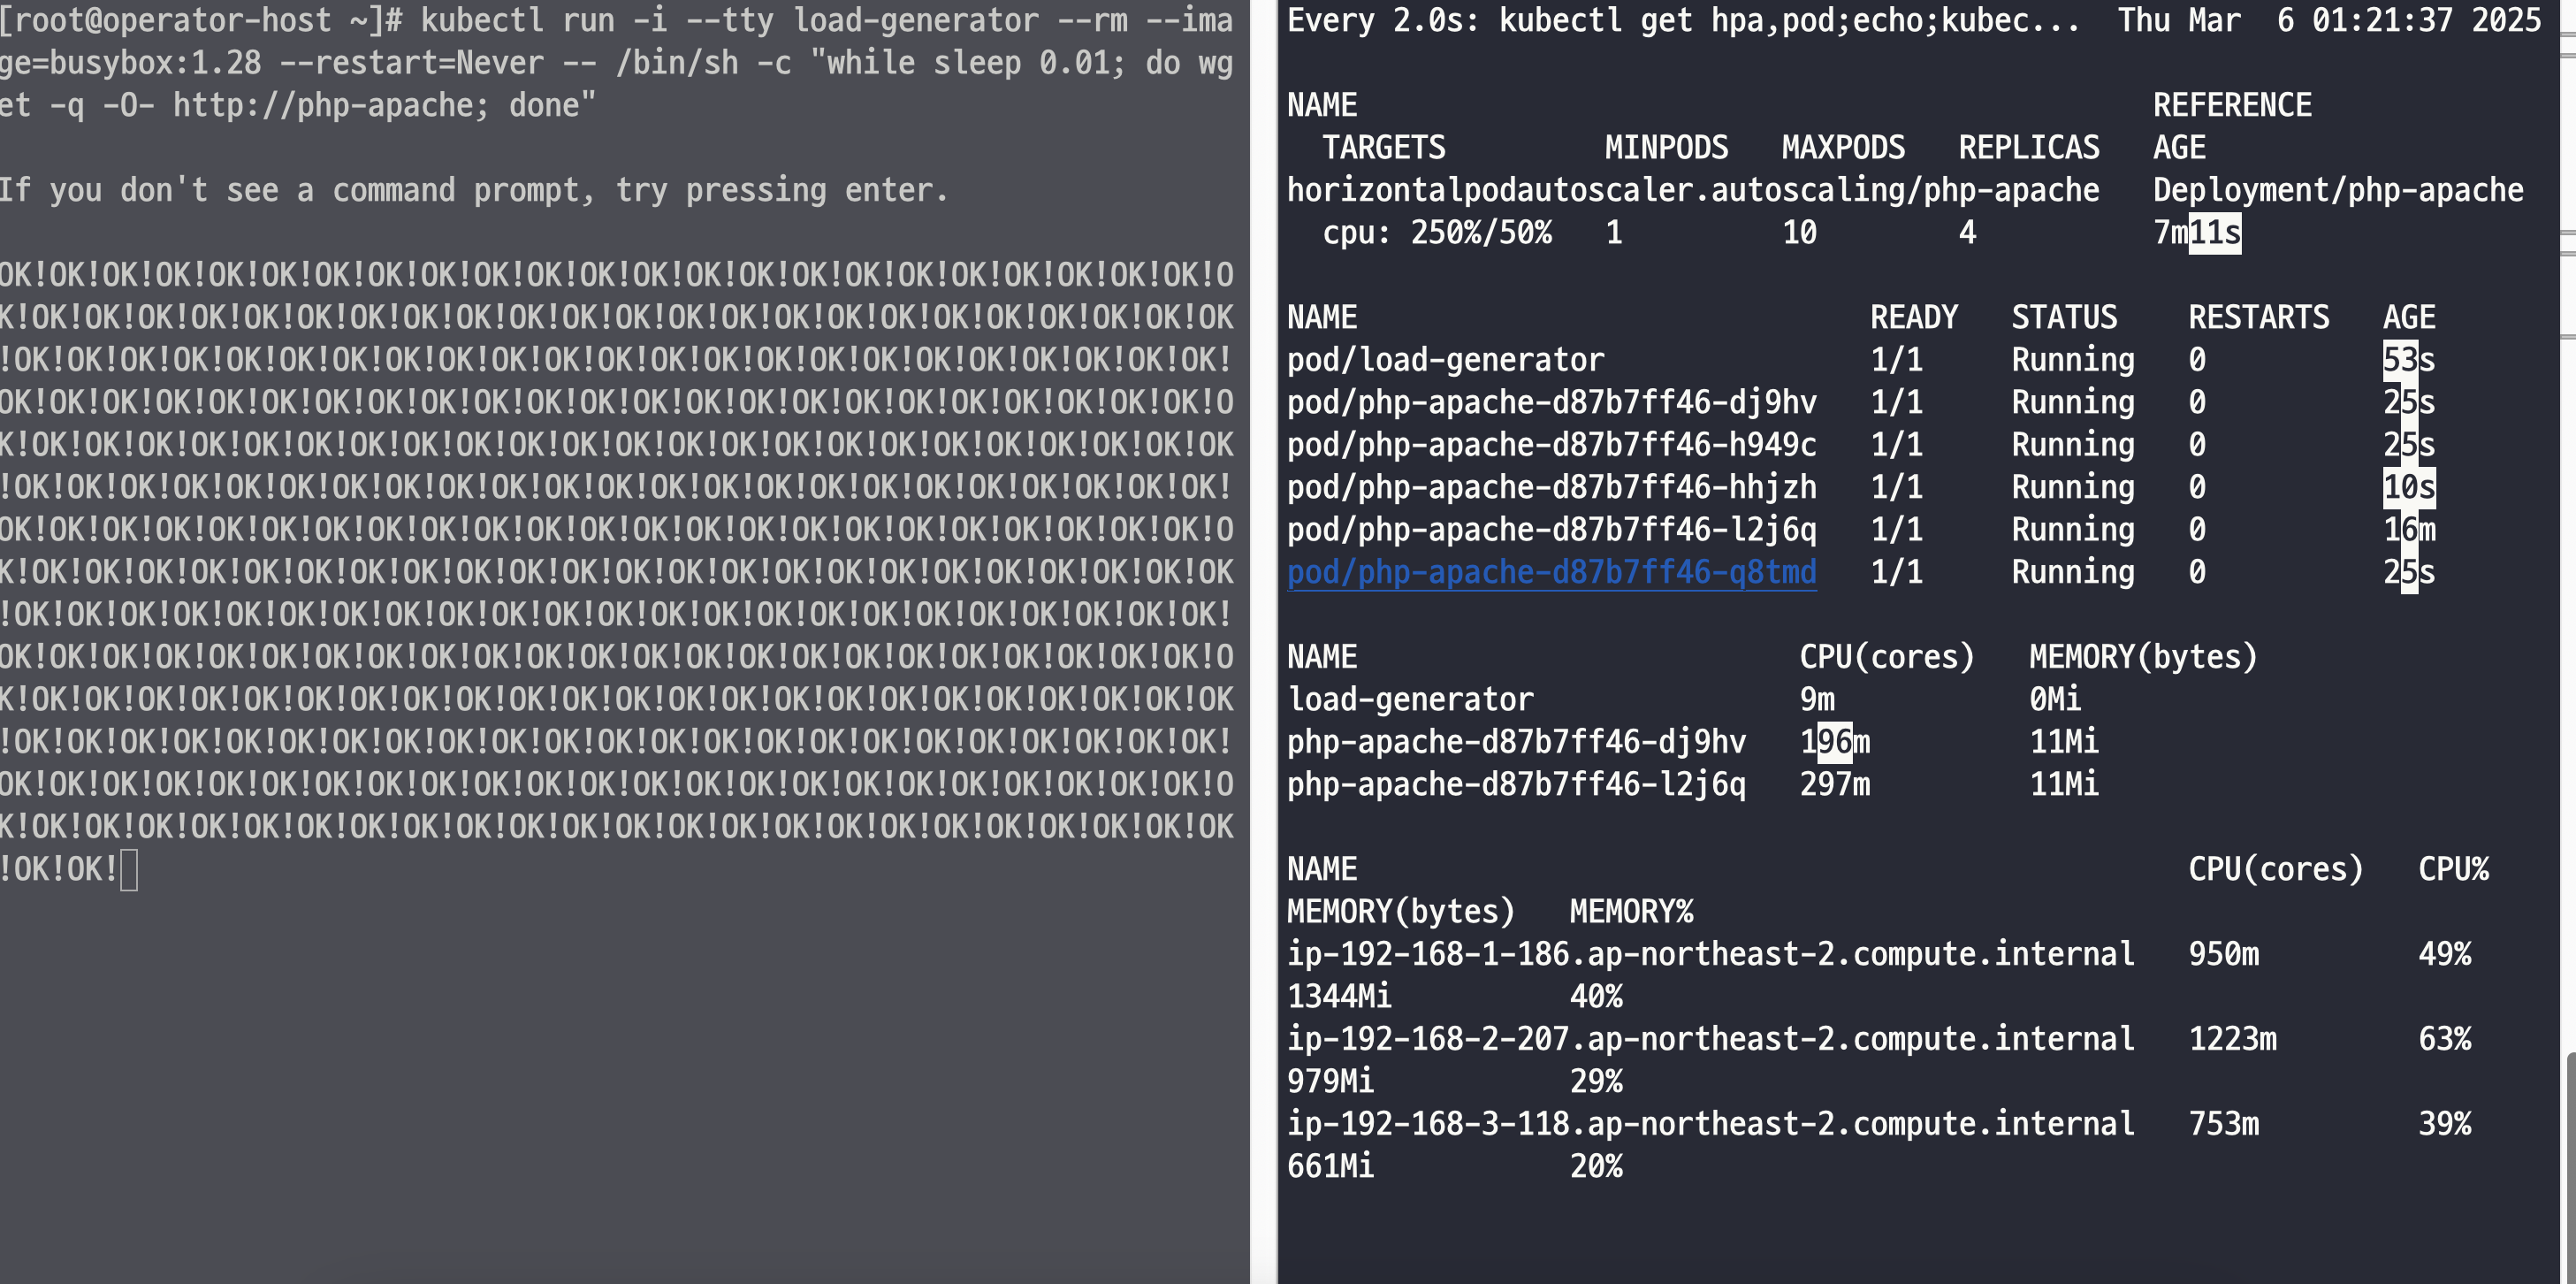
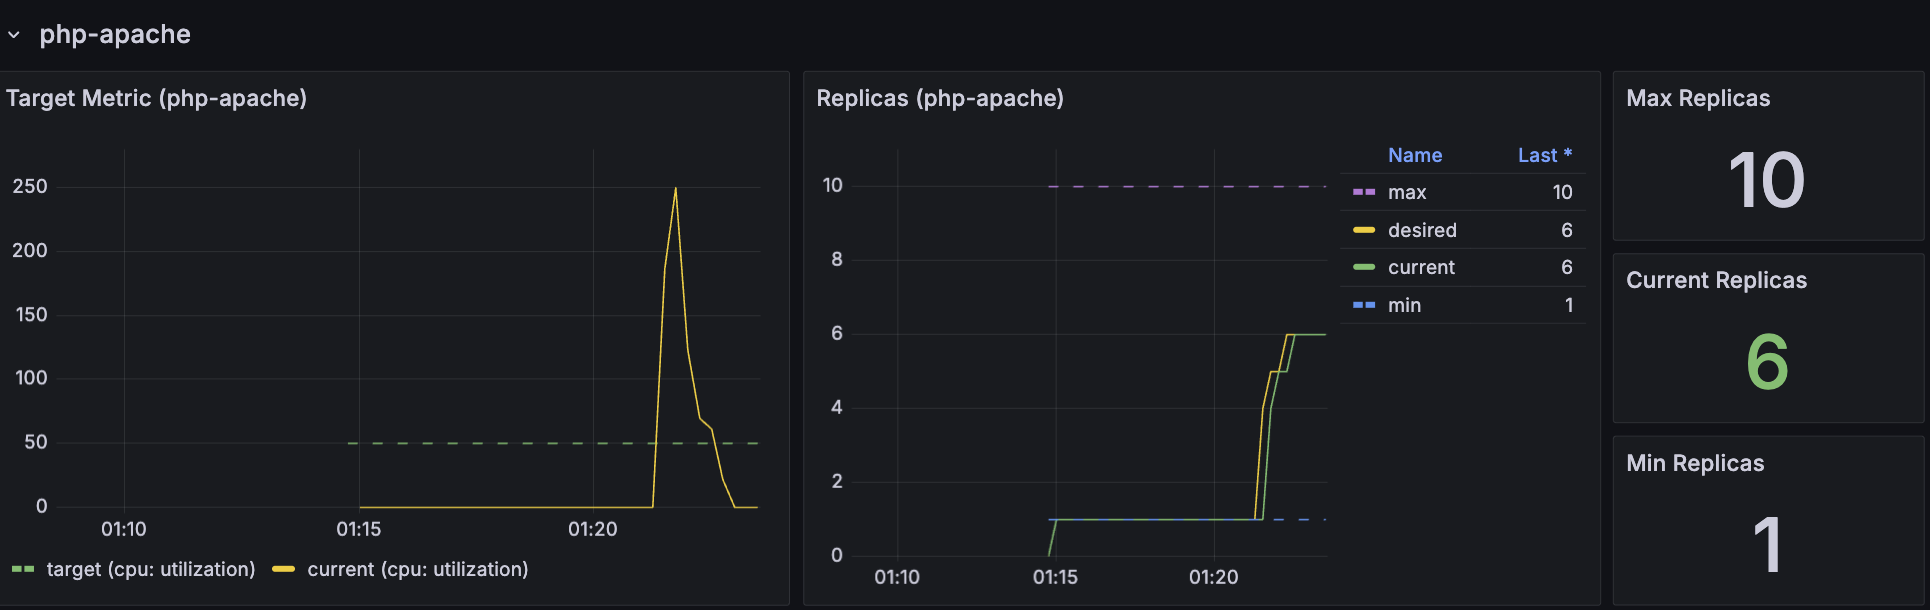
부하를 주기 시작하면 파드의 갯수가 늘어나는데 설정한 타겟 값인 50을 넘으면 레플리카 갯수가 늘어나는 것을 확인할 수 있다.
k describe hpa
Name:                                                  php-apache
Namespace:                                             default
Labels:                                                <none>
Annotations:                                           <none>
CreationTimestamp:                                     Thu, 06 Mar 2025 01:14:27 +0900
Reference:                                             Deployment/php-apache
Metrics:                                               ( current / target )
  resource cpu on pods  (as a percentage of request):  0% (1m) / 50%
Min replicas:                                          1
Max replicas:                                          10
Deployment pods:                                       6 current / 6 desired
Conditions:
  Type            Status  Reason               Message
  ----            ------  ------               -------
  AbleToScale     True    ScaleDownStabilized  recent recommendations were higher than current one, applying the highest recent recommendation
  ScalingActive   True    ValidMetricFound     the HPA was able to successfully calculate a replica count from cpu resource utilization (percentage of request)
  ScalingLimited  False   DesiredWithinRange   the desired count is within the acceptable range
Events:
  Type    Reason             Age    From                       Message
  ----    ------             ----   ----                       -------
  Normal  SuccessfulRescale  3m55s  horizontal-pod-autoscaler  New size: 4; reason: cpu resource utilization (percentage of request) above target
  Normal  SuccessfulRescale  3m40s  horizontal-pod-autoscaler  New size: 5; reason: cpu resource utilization (percentage of request) above target
  Normal  SuccessfulRescale  3m10s  horizontal-pod-autoscaler  New size: 6; reason: cpu resource utilization (percentage of request) above target
HPA는 최소 1개에서 최대 10개까지 자동으로 Pod 개수를 조정할 수 있으며 부하를 주어 6개까지 증설이 된 것을 확인할 수 있다.
Events:
  Type    Reason             Age    From                       Message
  ----    ------             ----   ----                       -------
  Normal  SuccessfulRescale  13m    horizontal-pod-autoscaler  New size: 4; reason: cpu resource utilization (percentage of request) above target
  Normal  SuccessfulRescale  13m    horizontal-pod-autoscaler  New size: 5; reason: cpu resource utilization (percentage of request) above target
커스텀 매트릭
쿠버네티스에서는 기본적으로 CPU 및 메모리 사용량을 기반으로 HPA를 구성할 수 있다.
하지만, 네트워크 트래픽, 요청 수, 사용자 정의 메트릭 등을 기반으로 Autoscaling을 수행하려면 Custom Metrics API를 활용해야한다.
HPA가 데이터를 가져오는 과정은 아래와 같다.
- Prometheus에서 메트릭 수집
- Prometheus가 cadvisor 또는 kubelet을 통해 container_network_receive_bytes_total 등의 메트릭을 수집한다.
- 이 메트릭은 Pod별 수신된 네트워크 트래픽(Bytes 단위)이며, Counter 타입이므로 계속 증가한다.
- Prometheus Adapter를 통해 Kubernetes Custom Metrics API에 노출
- Prometheus Adapter가 config.yaml 설정을 기반으로 Prometheus에서 container_network_receive_bytes_total 값을 가져온다.
- rate() 함수를 사용하여 초당 증가량을 계산하고, /1024를 나누어 KB 단위로 변환한다.
- 변환된 값을 network-traffic-receive-per-second라는 이름으로 Kubernetes Custom Metrics API에 노출한다.
- HPA가 Kubernetes Custom Metrics API에서 메트릭을 가져옴
- HPA가 kubectl get –raw “/apis/custom.metrics.k8s.io/v1beta1/namespaces/default/pods/*/network-traffic-receive-per-second” API를 호출하여 값을 조회한다.
- 특정 Pod에서 발생하는 네트워크 트래픽 양을 확인한 후, 설정된 Target Value(예: 100KB/s)를 초과하는지 판단한다.
- HPA가 스케일링 판단
- HPA가 current / target 비율을 비교하여 Pod 개수를 조정한다.
- 네트워크 트래픽이 기준보다 높으면 파드를 증설하고 기준보다 낮으면 파드를 감소한다.
hpa 수정
apiVersion: autoscaling/v2
kind: HorizontalPodAutoscaler
metadata:
  name: php-apache
spec:
  scaleTargetRef:
    apiVersion: apps/v1
    kind: Deployment
    name: php-apache
  minReplicas: 1
  maxReplicas: 10
  metrics:
  - type: Pods
    pods:
      metric:
        name: network-traffic-bytes-per-second
      target:
        type: AverageValue
        averageValue: 100k
k describe hpa php-apache
Name:                                          php-apache
Namespace:                                     default
Labels:                                        <none>
Annotations:                                   <none>
CreationTimestamp:                             Fri, 07 Mar 2025 01:24:37 +0900
Reference:                                     Deployment/php-apache
Metrics:                                       ( current / target )
  "network-traffic-bytes-per-second" on pods:  0 / 100k             # 커스텀 매트릭 추가한 부분
Min replicas:                                  1
Max replicas:                                  10
Deployment pods:                               1 current / 1 desired
Conditions:
  Type            Status  Reason               Message
  ----            ------  ------               -------
  AbleToScale     True    ScaleDownStabilized  recent recommendations were higher than current one, applying the highest recent recommendation
  ScalingActive   True    ValidMetricFound     the HPA was able to successfully calculate a replica count from pods metric network-traffic-bytes-per-second
  ScalingLimited  False   DesiredWithinRange   the desired count is within the acceptable range
Events:           <none>
prometheus adapter config
data:
  config.yaml: |
    rules:
    - seriesQuery: 'container_network_receive_bytes_total{namespace!="",pod!=""}'
      resources:
        overrides:
          namespace: {resource: "namespace"}
          pod: {resource: "pod"}
      name:
        matches: "^(.*)$"
        as: "network-traffic-bytes-per-second"
      metricsQuery: "sum(rate(<<.Series>>{<<.LabelMatchers>>}[1m])) by (pod)"
kubectl get --raw "/apis/custom.metrics.k8s.io/v1beta1" | jq .
{
    {
      "name": "pods/network-traffic-receive-per-second",
      "singularName": "",
      "namespaced": true,
      "kind": "MetricValueList",
      "verbs": [
        "get"
      ]
    },
    {
      "name": "namespaces/network-traffic-transmit-per-second",
      "singularName": "",
      "namespaced": false,
      "kind": "MetricValueList",
      "verbs": [
        "get"
      ]
    }
 }